4.0 INFORMATION & ANALYSIS
INFORMATION AND ANALYSIS ARE USED TO EVALUATE PERFORMANCE AND DRIVE FUTURE PERFORMANCE IMPROVEMENTS. OF INTEREST ARE THE TYPES OF TOOLS USED (FOR EXAMPLE, PEER COMPARATIVE DATA CLARIFIED AND VALIDATED THROUGH BENCHMARKING), AND HOW THE TOOLS ARE USED TO ENHANCE ORGANIZATIONAL PERFORMANCE. VARIOUS ASPECTS OF INFORMATION INCLUDE FACILITIES INSPECTIONS/AUDITS, FINANCIAL/EXPENDITURE REPORTS, UTILITY DATA, AND OTHER RELEVANT MEASURES AND INDICATORS.
Facilities and Services uses two primary sources for the measurement of comparative performance data to guide organizational improvement and decision making, the APPA Facilities Performance Indicators (FPI) and Sightlines.77 The Fire Department develops their own metrics, based primarily around response time and percentage of calls responded to, and Environmental Health and Safety has a more sophisticated statistical staffing tool that uses correlation analysis.78 All groups make use of the Facilities and Services Customer Service Survey and the Employee Engagement Survey.
Because of the diversity of various component units, the process that was used to build the Administration and Finance Strategic Plan took a ground up approach as to how the different work units would align with the plan. Each unit developed relevant objectives, and the executive team in Facilities and Services wrote key performance measures that were then included in the goals and performance evaluations for managers and directors. Each work group in Facilities and Services established Key Performance Indicators that are used to measure performance and drive action. We published much of this information earlier this year in what we called the President’s Budget Book, and we regularly include information about our performance against benchmarks in our newsletters.79
-
- Benchmarking data from peer institutions will be gathered from the APPA Facilities Performance Indicators survey, by trips to other universities, through anecdotal information at conferences, and by reviewing the facilities websites of other institutions. Consideration will be given to the engagement of a firm such as Sightlines. The analysis of this data will be used to guide OFS strategies.
- Operational data developed will include such items as work order backlog, work order cycle time, cost per square foot of custodial dollars, and cost per acre for grounds maintenance.
- A broad range of data will be developed on construction projects, including project budget, variance, change orders, and scheduling. Trade rates will be compared annually to local competitors in the construction industry.
- Facilities and Services employed Sightlines as a 3rd party benchmarking consultant and participates in the APPA FPI.
- FS reviewed key performance indicators with the help from James Cole of CommTech Transformations and Bob Casagrande of Casagrande Consulting.
- The KPIs were revised to align with the Administration and Finance Strategic Plan.
We believe that measuring performance and outcomes is important for demonstrating that our organization adds value, exceeds expectations, and delivers the desired result. In today’s competitive environment, we feel that doing our part for cost containment is essential to the success of the institution. In addition to reviewing the Customer Service Survey, each component unit in Facilities and Services has a set of Key Performance Indicators that are used to gauge performance and then drive action. These
primary metrics are listed below, along with some of their corresponding actions:- Work Order Phase Aging
- Workload balancing and customer service
- Overtime
- Monitoring for efficiency, staffing levels, potential outsourcing
- Work Order Phase Cycle Time
- Workload balancing and “early warning” of customer service issues
- Project Development and Engineering Construction Change Orders
- Evaluating design professionals
- Work Order Adjustments
- Evaluating customer satisfaction and potential fraud
- Project Development and Engineering invoicing
- Workload balancing and monitoring delivery time
- Requisitions Processing by time and by workload
- Workload balancing
- Project length average days
- Evaluating project managers
- Percentage expended of annual Building Renewals and Replacements (BRR) allocation
- Monitoring and accelerating project delivery times
- Number of days to place projects under design contract
- Monitoring and evaluating process
- Number of inspections performed
- Monitoring and evaluating compliance
- Number of safety trainings completed
- Mitigating worker injury and measuring output
Each of these measures is used to make adjustments to our processes at different levels, from daily operational decisions to annual budget preparation to development of longer‐term strategic goals. In many cases, the metric or measure in included in the performance evaluation of supervisors, managers and/or directors. Improving the percentage of the annual BRR allocation expended, for example, is a goal that has been shared with the top‐level administration and thus we measure our progress regularly.80
-
- This data will be shared with internal users and OFS constituencies.
- This data is shared in the OPS Meetings and in the monthly budget meetings.
- This data will be shared at the shop level.
- The Business Office conducts monthly budget meetings.
- AiM IQ dashboard was purchased.
All of our Customer Service and Employee Engagement Surveys are published on the website, as are our Sightlines reports. NMSU executed an Energy Performance Contract with Ameresco in 2014, and a key component of the project was the My Energy Pro Dashboard that will allow users to see the energy consumption of various buildings across campus on a user friendly website. In the future, we hope to use this dashboard to encourage competition between buildings, colleges and/or dormitories to reduce energy consumption.81
Facilities and Services uses AiM from Assetworks as our computerized maintenance management system. NMSU has purchased several add‐in modules, most recently the AiM CAD space management tool and AiM IQ, the dashboard. We also are an early adopter of ANA, the Assessment and Needs Analysis module. AiM CAD is a tool for space management that will allow for architectural drawing information to be imported into AiM, and is a long‐term investment in a system for tracking space utilization data. The Space Management staff maintains the Delta‐T shared drive, where we archive our as‐built drawings and manuals. AiM IQ is a “front end” that provides dashboards to make the facility data user friendly, and the ANA module allows for the tracking and analysis of Facilities Condition Index data.82
Mobile applications are being deployed to the service technicians and project managers so that they can work from the field.
Financial Systems Administration defines user roles and tables for the appropriate security level in AiM.
-
- Past audits and studies will be reviewed, and a regular inspection program will be established if one is not already in place.
- Facilities and Services engaged Arcadis to update the Comet 2006 condition report.
- Townsend and Associates has reviewed construction practices.
- Sightlines assist FS with walking the campus annually.
- FS purchased the AiM CAD module for space management and is using the ANA module for assessment and needs analysis.
In 2006, the state of New Mexico contracted with Parson’s 3DI to assess all higher education facilities in the state and to develop a Facilities Condition Index (FCI) for each facility. At the time, this was intended to be the methodology for assessing capital outlay and capital renewal funding requests. This effort was abandoned at the state level in 2008, so in 2010 NMSU contracted with Arcadis, an assessment firm, to bring the 2006 assessment up to date. Facilities and Services then began tracking the FCI though AiM, and we joined Assetworks for a beta test with the new Assessment and Needs Assessment (ANA) module. This installation is nearly complete and will allow for updates to be made both from inspections and by reducing the needs automatically through the work order system as remedial maintenance is performed.
Facilities and Services receives an annual allocation for capital renewal and we created a Building Renewals and Replacements (BRR) task force that met every other week for a year to develop a 3‐5 year BRR plan. We used a number of reports that we have commissioned in the development of this plan: Roof Assessment by BTA; ThyssenKrupp Elevator Assessment; AON Fire Protection and Life Safety System Assessments; Bohannon Huston Site Electrical Infrastructure Master Plan; GLHN Utility Development Plan; Accessibility Survey of Campus Buildings; NMSU Data Center Planning Report; Las Cruces Campus Drainage Study; Structural Integrity Study for the NMSU Utility Tunnel; Chemistry and Biochemistry Exhaust System Study; and the Water Master Plan. This Building Renewals and Replacements plan was put together with input from staff in Facility Operations, Project Development and Engineering, Environmental Health and Safety (EHS), the Fire Department, the University Architect, and the University Engineer.83
EHS has implemented a mobile fume hood assessment and certification‐tracking module in AiM, and the EHS annual high hazard area audit includes a facilities safety review.84
The Fire Department has developed a fire safety building inspection program in which every building on campus is on a planned schedule for review. The Fire Department and Facilities Operations staff tests and inspects each of the 185 fire hydrants on a yearly basis. This information is recorded in the Emergency Reporting System and is available when needed.85 The Fire Department works closely with the Facilities and Services Executive Director of Operations to ensure that corrective actions have taken place.
We subscribe to the capital renewal budgeting model that states that we will place facilities into the “Keep Up,” “Major Maintenance,” and “Gut Renovation” categories, and generally avoid maintenance expenditures on those buildings that are grouped in the latter stage. We have been moving in this direction, although communicating this change to the campus and staff will take some time. Those facilities in the “Gut Renovation” category will be addressed though our Capital Outlay Process.86
-
The Facilities and Services business office meets with all units regularly, and in most cases this occurs monthly. The overall facilities and services budget is placed on the Facilities and Services shared drive and is discussed at different levels and shop meetings regularly. This budget document includes an Excel tab for each sub‐unit.87 The expenditures are compared with peer and APPA regional data regularly though the use of Sightlines and APPA Facilities Performance Indicators (FPI), because while we operate on the premise of “no new money,” we do make internal re‐allocations for equitable distribution of workload and staffing. As to if this is effective, the “proof is in the pudding” so to speak; Facilities and Services routinely closes out the budget year slightly under budget. While one or two units may exceed their budget, we know about this in advance and make corrections through the reallocation process.
-
- Management reports will be generated that provide information BTU / GSF / YEAR although an extensive submetering system may have to be set in place first. Performance Contracting will be investigated as a means to accomplish both of these needs.
- The AiM utility module has been implemented, and a Sustainability Manager assists with tracking of energy expenditures.
- A Performance Contract has been awarded and is in the implementation phase.
- One of the features of the Performance Contract is a dashboard; another is the “typical room.”
- Progress continues to be made in many areas with utility management.
All of our utility data is tracked in AiM, our facility management system. Facilities and Services operates the Central Utility Plant “as if” we are a utility with rates that include “impact fees” for new chilled water connections and that capture funds for repair and renovation. Our organizational funding and operational model is partially based upon our discussions with the University of New Mexico, the University of Virginia, and the University of Arkansas. The Facilities Utilities Manager oversees the meter reading, billing, and rate development, and while we are not quite to the point where every utility is metered at every building, we are working towards that goal. In 2012, we commissioned the satellite chilled water plant that allows us to make ice at night to be used the next day for chilled water. By doing this, we avoid electrical demand charges during the peak daytime hours.
The Environmental Health and Safety Department has installed remote monitoring of backup generators for emissions compliance; this eliminates trips by staff to the equipment site to record operating hours.88
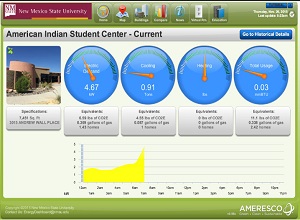
In 2014, NMSU executed a $15 million dollar Performance Contract with Ameresco. In addition to providing numerous infrastructure improvements that will pay for themselves with energy savings in the first thirteen years of the project, we have installed the My Energy Pro Dashboard that provides for userfriendly monitoring by anyone with internet access. This dashboard will be used to foster an energy conservation competition between buildings, and it also illustrates typical energy costs of devices found in offices and dormitory rooms. The Sustainability Manager will use this to help foster behavior change.89
- Periodic reviews with ICT will be scheduled.
- Financial Systems Administration (FSA) has initiated a regular review process and established an equipment replacement schedule.
- FSA has added additional positions to support Facilities and Services.
- FSA has several replacement programs in place.
- The hardware and software systems are evaluated annually with a programmatic approach.
Financial Systems Administration (FSA) works closely with Facilities and Services to provide hardware and software support. FSA maintains a guidance document with a stated goal of achieving a 20–25% computer replacement per year: “PC evaluation and distribution determination process.” This process allows us to maintain a 3‐5 year replacement cycle for all employees’ computers.90 An evaluation is completed twice a year, and a standard hardware configuration is maintained for ease of deployment to every user. FSA also keeps 3‐5% of their total machines as spares for new employees or emergency replacements.
In addition to these efforts, mobile devices are being deployed across Facilities and Services so that technicians, Project Managers, and other staff can work from the field.91